Course Review: Computational Investing Part 1 offered by Georgia Tech on Coursera
Algorithms and visualizations for portfolio analysis and the stock market as taught by Georgia Tech’s Tucker Balch
Review by Henrik Warne. Originally published here. Took the course? Write your own review here.
I recently finished the Coursera course Computational Investing Part 1 by professor Tucker Balch at Georgia Tech. The focus of the course is on portfolio analysis and selection. Almost all the analysis uses the daily closing prices of stocks as the starting point. The concepts are not particularly difficult and the programming exercises give you good hands-on experience with the different analysis techniques. The assignments are in Python using several tool kits for time series analysis such as NumPy, Pandas and QuantSoftware.
THE COURSE
Computational Investing Part 1 starts with the concepts of risk and return for stocks. The return is how much money you made or lost during the period. Risk is defined as the volatility, which is how much the return (for example the daily return) varies. This is usually measured as the standard deviation of the return.
To compare different stocks or portfolios, the Sharpe ratio is introduced.
When calculating the Sharpe ratio, the return is the return above a risk free rate, and the ratio is the average return divided by the standard deviation of that return. The higher the number, the better. For two portfolios with the same return, the one with the lowest variability has the highest Sharpe ratio, and is therefore preferred. The assumption in the course is that the risk free rate of return is zero, which simplifies the calculations somewhat.
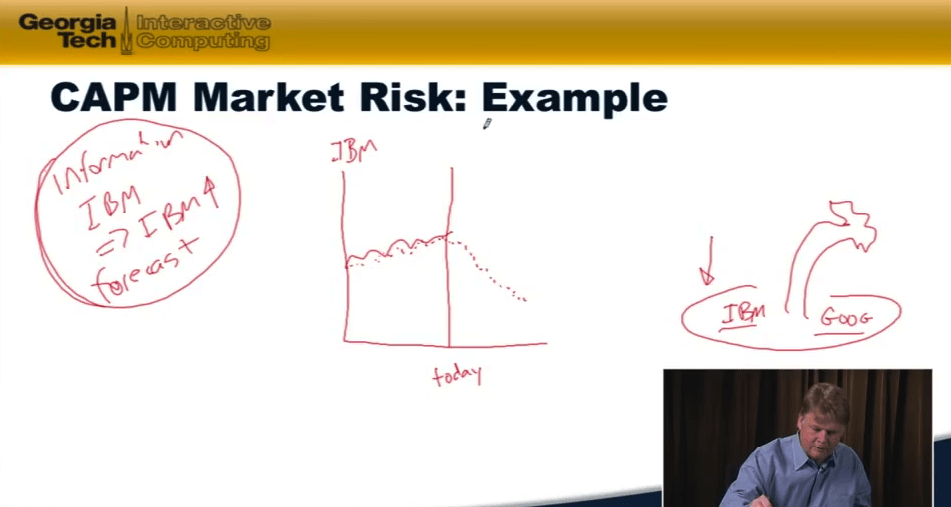
Next there is a section on how an exchange works such as order books, matching of orders, or the impact on price of a large order. Then the value of a company as calculated by the discounted value of all future dividends is explained. Next up is the Capital Asset Pricing Model (CAPM), portfolio diversification and the efficient frontier.
Then comes the Efficient Market Hypothesis (EMH), event studies and the fundamental law of active management. The final part is about technical analysis, in particular about Bollinger bands. Professor Balch does a very good job explaining all of these concepts.
ASSIGNMENTS & QUIZ
The first week, there was a multiple choice quiz with five questions about hedge funds, risk, standard deviation and Sharpe ratio. For the rest of the weeks, there were only programming assignments. The first of those only involved installing Python and the various tool kits, which went smoothly for me.
The installation came with several complete examples, and many of the programming assignments were just a matter of modifying the example code a bit to arrive at the solution. I like this even if it made some of the programming assignments pretty easy. The advantage is that you don’t have to spend any time writing “plumbing” code, like fetching the daily closing prices for a given stock. Instead you can concentrate on the core problems.
The advantage is that you don’t have to spend any time writing “plumbing” code, like fetching the daily closing prices for a given stock.
The first real programming task came in week three. The sample code already calculated the daily returns for a given stock. For the assignment, you had to first find the Sharpe ratio of the daily returns, both for one stock and for a portfolio of four. Then, given four stocks, you had to find the proportions of those four stocks that gave the highest Sharpe ratio for the portfolio for the year. This took me a while to get working, and it was the second hardest programming assignment.
The next programming task was to find events to use in event studies. For example, find all stocks and the corresponding dates where the price fell below five dollars. This was really easy, since there was existing code doing that. The only work required was to alter the condition for what should be considered an event.
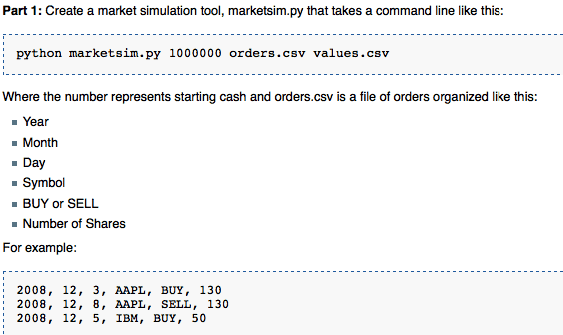
The hardest programming task came next – creating a market simulator. The program should take as input buy and sell orders for a given stock at dates in the past. With a starting capital of say $100,000, and access to the historical prices for each stock each trading day, you then had to calculate how much money you would have made or lost given those buy and sell orders. It is not conceptually hard, but there are a lot of details to get right for it to work properly. This assignment took the longest time by far for me to complete.
It showed how event detection can be used to generate an investment strategy, and how it can be back-tested.
The market simulator and the event detection program were combined in the next task. The event detection code found all cases where the price fell below nine dollars. When it did, a buy order was generated for that stock at that date, and a sell order was generated five days later. All these buy and sell orders were then fed into the market simulator. This was really neat. It showed how event detection can be used to generate an investment strategy, and how it can be back-tested.
Next came technical analysis, in the form of Bollinger bands. Simply put, you look for prices that either go well above or below their typical values over the past number of days (twenty in the assignment). That would constitute a buy or sell signal. The final assignment was to find events using Bollinger bands, and run the buy and sell orders through the market simulator.
The degrees of freedom (ddof) parameter has different default values in different libraries, which affects the calculated value
One problem I had with the programming assignments was the calculation of the standard deviation. The degrees of freedom (ddof) parameter has different default values in different libraries, which affects the calculated value (more information in this Stack Overflow question). Another mistake I made was to not check properly if I needed the closing price or the adjusted closing price. Of course I managed to use the wrong time period once as well – a small mistake that took a while to find.
SUGGESTIONS
In reviews of previous offerings of this course, I have seen people complaining about low production value such as hand-drawn diagrams and uneven sound quality. I agree with that, but the actual content is still good. The intro’s and outro’s which contain music, however, are unnecessary and should be removed.
One minor problem was example input and output for the programming assignments. To debug your program, you need some smaller sized inputs, and the expected outputs. To be fair, there were some sample inputs and outputs which is something other courses I have taken haven’t provided. However, the examples were too small. Some bigger examples would have been quite useful as well. In other courses, sample inputs and outputs were instead posted in the forum by fellow students. However, this course didn’t use the regular Coursera forum. Instead, it used something called Piazza. It was a lot harder to navigate and I had trouble both contributing and finding what I was looking for.
The answers to the programing assignments were submitted using multiple choice questions. This, plus that fact that you had five tries for each question, meant that you could perhaps guess the correct answer. I am a fan of allowing many tries, since it makes you engage more and gives you a reason to try again. At the same time it should not encourage plain guessing. If the answers to the programming assignments were entered as just one number, maybe with a tolerance, it would be harder to just guess, but would at the same time allow multiple tries. This is how it was done in both Algorithm courses I took.
CONCLUSION
I liked this course. It covered a lot of concepts in portfolio analysis and selection, and they were all explained quite clearly. The programming assignments made me apply the concepts, which made the new knowledge stick. I didn’t buy the book, but I felt that I learned a lot just by watching the lectures and doing the assignments.
Editors Note: Review by Henrik Warne. Henrik is a software developer in Stockholm, Sweden. He has been programming professionally for more than 20 years, and still loves to code!
Class Central is looking for reviewers and regular contributors. If you’ve ever finished a MOOC and want to write a critique to help future students considering taking that course, we want to hear from you. Drop us a mail.


Matteo Ferrara
I recall this as the first Mooc I try to take in 2013, I didn’t have any idea of what python was. Useless to say I dropped it almost immediately. I just remember he was a pilot in the airforce.